
Introduction to Automating Report Generation
Why Automate PDF Reports?
In many businesses, generating PDF reports from raw data is a routine yet laborious task. Manually compiling and formatting data into presentable reports consumes significant time and resources. Automation not only accelerates this process but also enhances accuracy by reducing human error. Moreover, automated reports can be consistently styled and structured, ensuring uniform communication across different teams or clients. The demand for such streamlined processes is growing as organizations increasingly depend on data-driven decisions and timely reporting.
Overview of Tools: Python Pandas and ReportLab
Python offers a robust ecosystem for automating report generation, with Pandas and ReportLab standing out as essential tools. Pandas simplifies data handling by providing efficient structures to load, clean, and manipulate CSV data. Meanwhile, ReportLab excels in generating PDF documents programmatically, offering high flexibility in layout and design. Together, these libraries empower users to convert raw CSV data into polished PDF reports automatically. While other tools like Plotly or PyFPDF exist, they often come with limitations regarding page layout control or require cumbersome manual configurations, making Pandas and ReportLab a preferred choice for many developers.
Preparing Your Environment
Installing Python and Essential Libraries
Before diving into automation, make sure Python is installed on your system. The next step involves installing necessary libraries using Python’s package manager. To install ReportLab, a reliable version is essential; specifically, using
pip install reportlab==3.6.* ensures compatibility and stability. Alongside, install Pandas for data manipulation and Matplotlib if you plan to include graphs in your reports. These installations form the foundation for efficient report automation, seamlessly integrating data processing and PDF creation.
Setting Up Your Workspace
Organizing your workspace is crucial for smooth development. Create a dedicated project folder where you will save your Python scripts, CSV files, and generated PDFs. Using a virtual environment is highly recommended to maintain dependencies isolated and avoid version conflicts. Once your environment is prepared, you can readily test and modify scripts without impacting other projects or system-wide packages.
Understanding CSV Data and Pandas
Loading CSV Files into Pandas DataFrames
CSV files are common formats for tabular data, easily exported from spreadsheets or databases. Pandas provides the read_csv() function, which efficiently loads CSV data into DataFrames—a powerful data structure resembling tables. This step is foundational because it transforms raw text data into a manipulable format, allowing further data cleaning or transformations required before reporting. Proper understanding of your CSV structure and headers ensures accurate loading and interpretation of data.
Data Cleaning and Manipulation Techniques
Raw data is often imperfect, containing inconsistencies or missing values. Using Pandas, you can apply techniques like filtering, replacing missing entries, renaming columns, and formatting dates to prepare a clean, consistent dataset. Performing these steps prior to PDF generation guarantees that reports reflect accurate and comprehensible information. For instance, you might want to sort data chronologically or group values by categories, which Pandas handles efficiently with simple commands.
Creating PDFs with ReportLab
Basics of ReportLab for PDF Creation
ReportLab is a powerful Python library that allows programmatic creation of PDF documents. At its core, ReportLab’s Platypus module manages complex page layouts using high-level building blocks such as paragraphs, tables, images, and spacers. Unlike manual positioning, Platypus allows content to flow automatically within defined frames. However, ReportLab modifies objects in place during document building, which can cause challenges in iterative environments like notebooks. Familiarity with its error messages and documentation—albeit mostly in PDF format—is important for troubleshooting.
Designing Report Layouts and Templates
Effective PDF reports require thoughtful layout design. ReportLab enables this by letting you define frames, which are specific areas on a page where content will flow. You can then group these frames into page templates and customize elements like headers, footers, logos, and page numbers using onPage callback functions. Assigning IDs to page templates makes switching between different layouts (such as portrait or landscape) easy. Consistent padding and manual positioning of recurring elements like page numbers enhance the visual appeal and readability of your reports.
Integrating Pandas Data into PDFs
Extracting Data for Reporting
Once data is cleaned in Pandas, the next step is extracting relevant portions for the PDF. Instead of processing rows one at a time, it is crucial to aggregate all rows into a collective data structure, such as a list of lists, representing the entire table. This avoids common pitfalls where only the last record appears in the PDF due to document creation inside a loop. Proper data aggregation ensures that the entire dataset is represented cohesively in the report.
Dynamic Table Generation in PDFs
To display tabular data, ReportLab’s Table class can create tables that span multiple rows and columns. Creating the Table object outside of any iteration loop ensures that the entire dataset is included. Apply a consistent style to the whole table to maintain uniform cell formatting, borders, and spacing. Using Paragraph with styles for individual cells enhances the appearance by supporting formatted text within table cells. This structured approach prevents errors where only the final table is shown or multiple pages are unnecessarily created due to repeated document rebuilding.
Putting It All Together: Automation Script Walkthrough
Writing the Python Script Step-by-Step
The script begins by importing libraries, followed by reading the CSV into a Pandas DataFrame. After cleaning and preparing your data, aggregate it into a list that includes headers and all rows. Next, define the report layout using Platypus frames and page templates with relevant onPage callbacks for headers and footers. Create the Table object with the aggregated data and apply appropriate styles. Add the table and any additional content like introductory paragraphs or images into the elements list. Finally, create the PDF document object and build it once outside any loops, ensuring all content is included in a single document rather than multiple overwritten files.
Scheduling Automated Report Generation
To fully automate report generation, schedule your Python script to run at desired intervals using system tools like cron jobs on Linux or Task Scheduler on Windows. This approach enables unattended report updates, for example, generating weekly sales summaries or monthly performance reports from updated CSV files. Testing the script thoroughly before scheduling ensures smooth execution and reliable output, while logging can help monitor for any issues over time.
Advanced Tips and Customizations
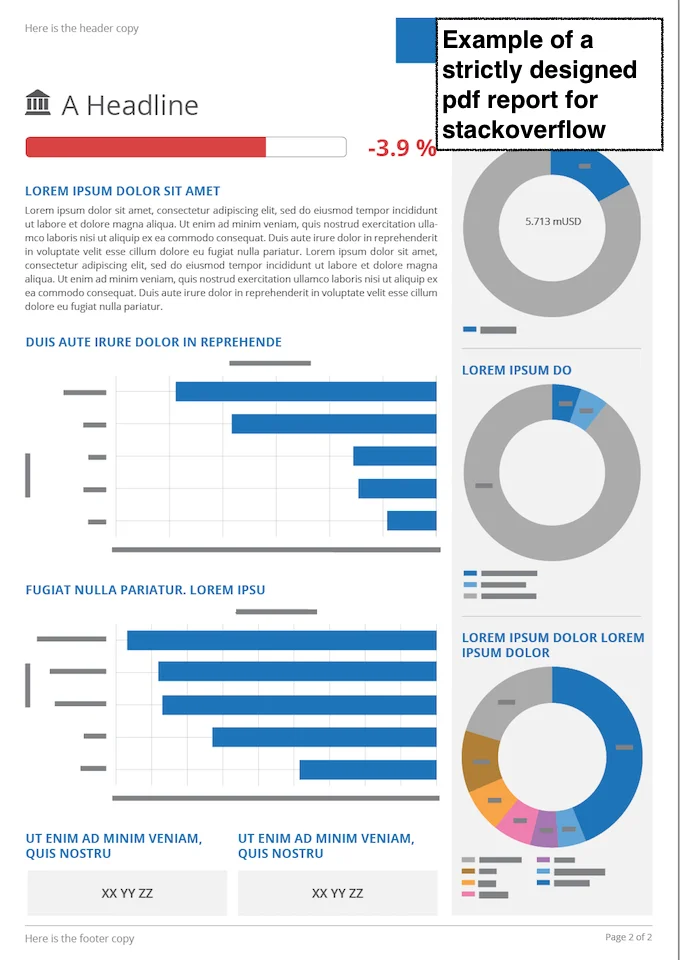
Adding Charts and Graphs to Reports
Visual data representations significantly enhance report clarity. Using Matplotlib alongside Pandas, you can create charts such as bar graphs or line plots. Saving these charts as images and embedding them into the PDF with ReportLab greatly enriches your reports. Careful placement and sizing within frames maintain cohesive layouts. This integration provides both numerical tables and illustrative graphics, catering to diverse reader preferences.
Handling Large Datasets Efficiently
Large datasets pose challenges in generating clear and performant PDFs. To handle extensive data, paginate tables by splitting your data into chunks and creating multiple pages or tables accordingly. Optimize table styles to avoid excessive complexity, which can slow rendering. Additionally, consider summarizing data with aggregations or filtering to include only the most relevant information. Proper management of memory and processing steps ensures your automation scales well without degrading report quality.
Conclusion and Next Steps
Automating PDF report generation using Python’s Pandas and ReportLab combines the strengths of efficient data handling and robust document creation. By understanding how to prepare your environment, clean data, design layouts, and integrate content dynamically, you create professional and consistent reports with minimal manual effort. Moving forward, experiment with advanced features like dynamic charts and multi-page layouts. Continuously testing, refining, and scheduling your scripts will establish a reliable reporting pipeline that saves time and enhances business insights.


